When thinking about how to contribute to KDE, many people probably still think that you have to write actual code. While it’s true that C++ and QML is at the heart of our applications, it’s just one puzzle piece of many that make up a successful product. Besides donating money to KDE or developers like me individually, there’s much more you can do to support us: promo work, drawing icons, brainstorming ideas, writing documentation, triaging bug reports or writing new ones, or in this case sending the relevant piece of hardware to a developer. Every single contribution counts!

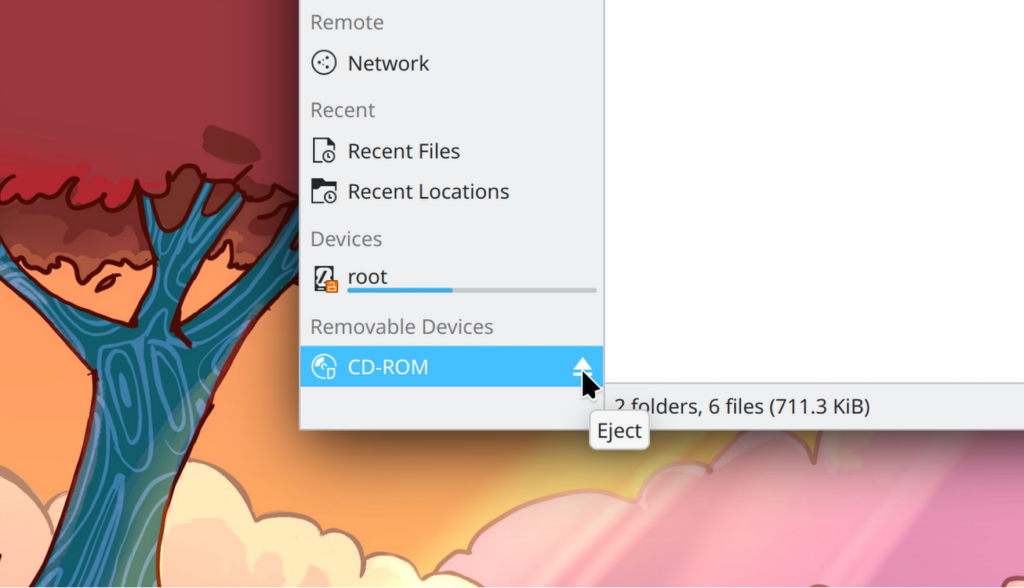
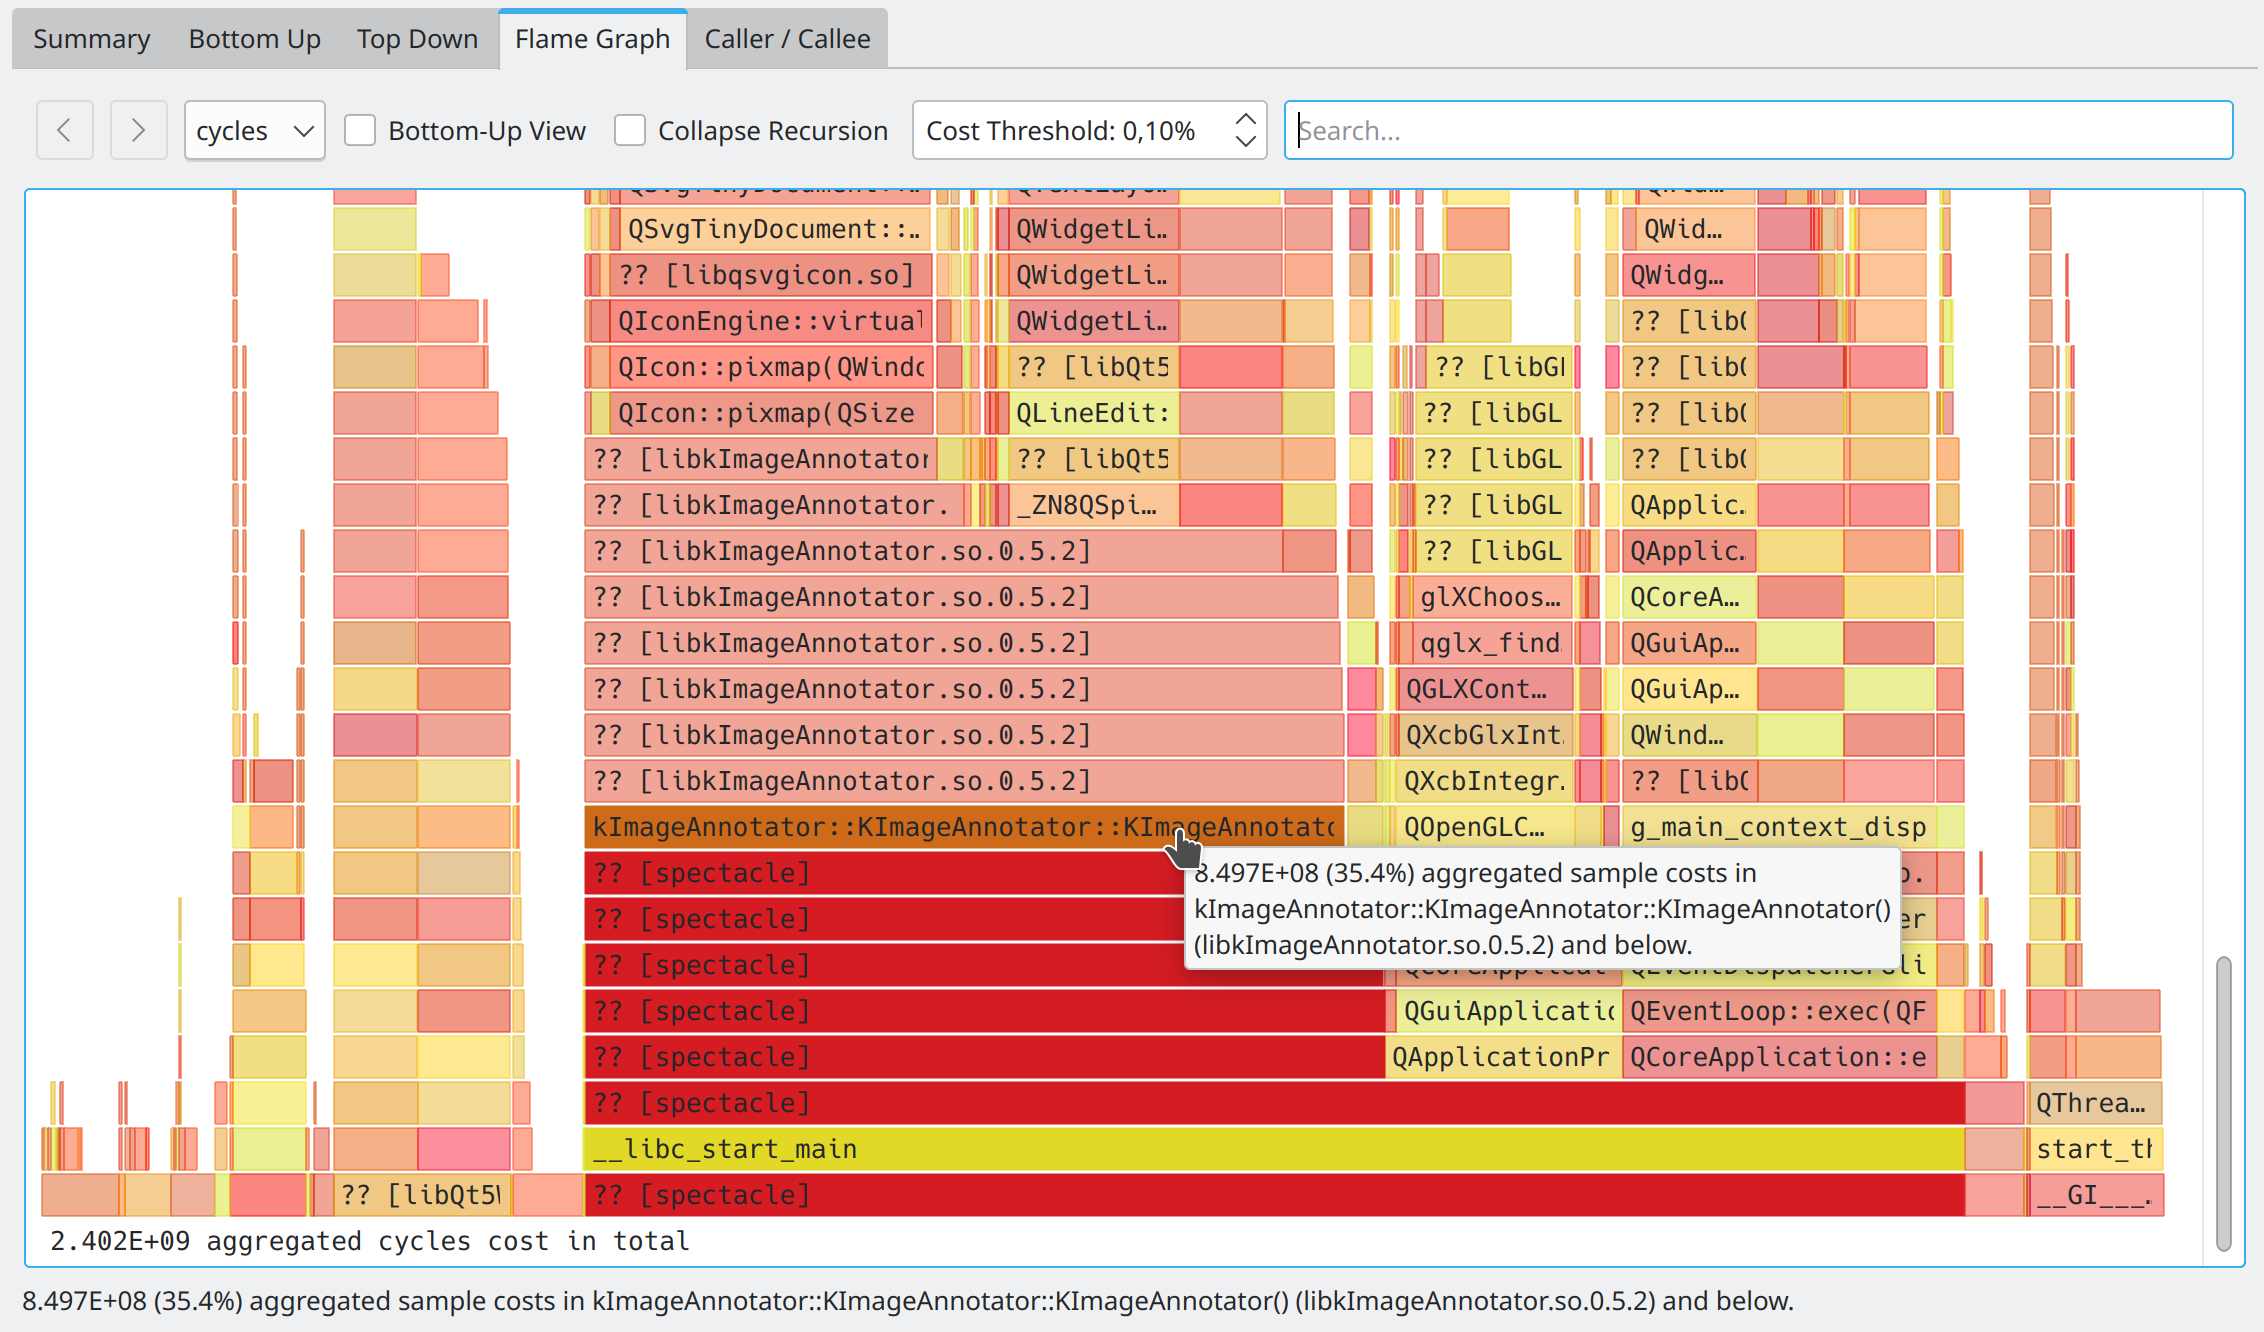
A key ingredient to KDE’s cross-platform story is Solid, our device integration framework. It lets applications enumerate devices, such as hard drive partitions, USB thumb drives, but also batteries and peripherals, in a platform-independent way. When it comes to hardware, sometimes emulating its behavior is tough and even a virtual machine might not behave exactly the same as the real thing. Here’s the story of how the donation of a portable DVD drive let me unlock a massive performance boost.
Continue reading Contributing is more than just code